Have you been looking for useful Tradingview indicators that can give you good estimates and help you trade in the market? If yes, then congratulations! you have come to the right place. In this post, I will introduce 6 useful Tradingview indicators that we use on a daily basis and I will also show you some exclusive indicators that our team has developed and you can download for FREE! Without further ado, let’s get started
Table of Contents:
- 4 Most Useful Tradingview Indicators
- Relative Strenght Indiex (RSI)
- Stochastic Relative Strenght Index
- Visible Range (VPVR)
- Historical Volatility Percentile
4 Most Useful Tradingview Indicators
Here you can find the 4 best and most useful tradingview indicators explained and demonstrated in simple language. I have tried to start from the easiest and move towards a more advanced one in each section.
Relative Strenght Index (RSI)
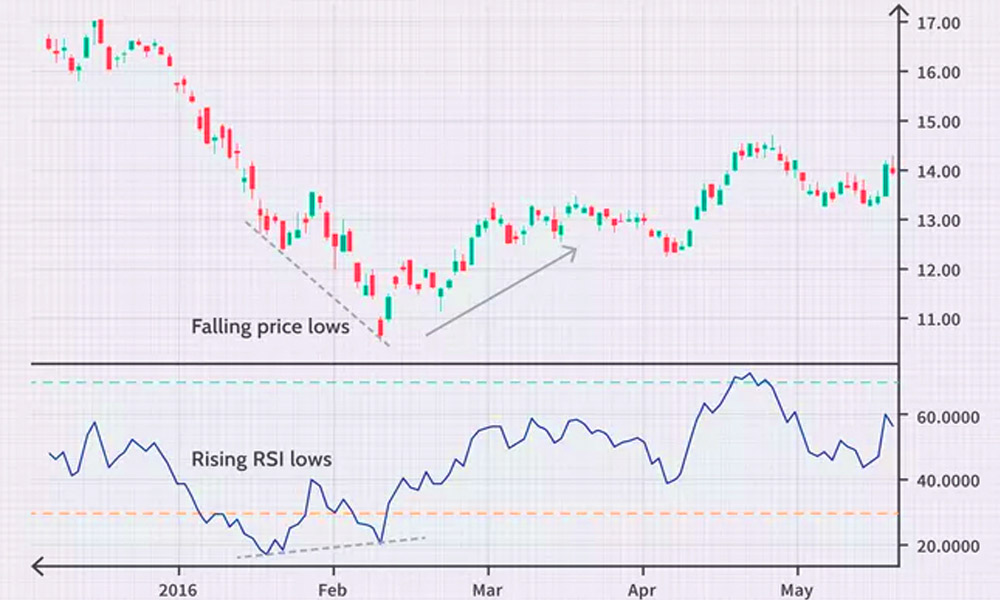
The first indicator I highly recommend using is the Relative Strength Index commonly known as RSI. Basically, this useful tradingview indicator is going to give you some idea of the momentum of the market of the price action of the PA.
This is one of the best indicators for spotting divergences and changes in trend on any time frame. The Relative Strenght Index indicator measures the speed and direction of a trend. This highly efficient indicator is used to identify so-called ‘ overbought ‘ or ‘ oversold ‘ situations.. However, please note that a major disadvantage of this indicator is that it does not take into .account the traded volumes and therefore, for a better technical analysis, we recommend using the RSI indicator with other tradingview indicators to get better results.
Stochastic Relative Strenght Index (Stoch/RSI)
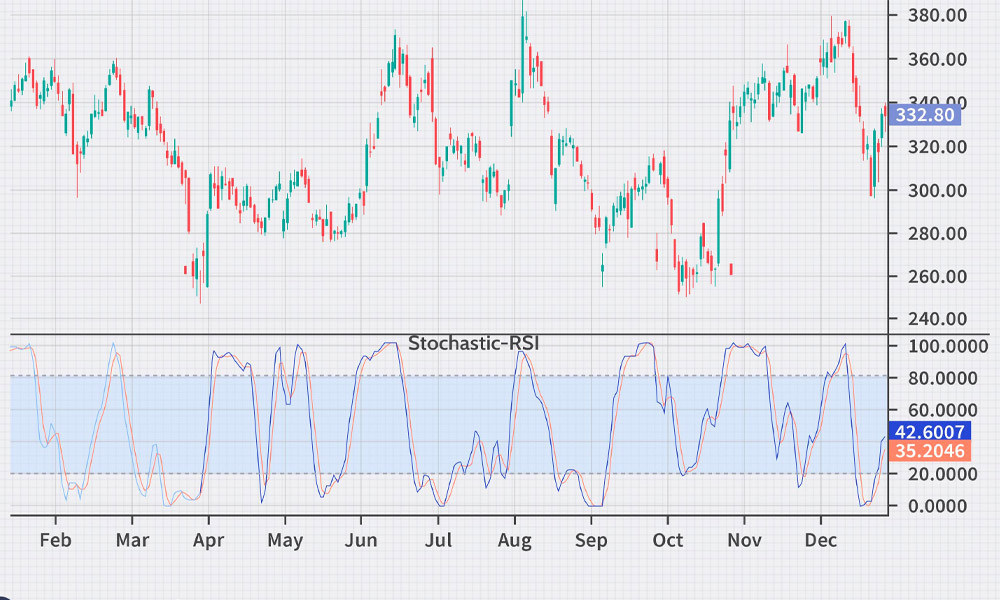
The next indicator is quite similar to the first one. The Stoch/RSI indicator is a more exponential version of the RSI indicator that we discussed in the first section of this article. But what does it mean to be ‘more exponential? let me explain.
As you can see in the picture below, the stochastic relative strength index puts more a lot more weight on the most recent price action. Similar to how an EMA or an Exponential Moving Average puts more weight on the most recent price point of data, this Indicator gives you more exponential value and it is much better for trying to time the top of scalp trading type of strategy.
In addition, this useful tradingview indicator also gives you divergences. So, by looking at the chart you can see how higher highs or lower lows of the chart behave. You can use this type of indicator to identify very quickly the bullish and bearish divergences on a regular scale.
Now, you might ask, what if I want to combine the two indicators?
Our answer to this question is positive. Doing this will give you another line and layer of data to look into while making trading decisions. Each indicator can act as a separate pair of glasses to look through. So never hesitate to use multiple indicators before making any serious decisions!
- Rule of thumb: A StochRSI reading above 0.8 is considered overbought while a reading below 0.2 is considered oversold. In other word, on the scale od 0 to 100, above 80 means overbought, and below 20 means oversold.
With this, let’s move to the next useful tradingview indicator on our list.
Visible Range (VPVR)
The VPVR is a very powerful tool and you can use it in any time frame. What this useful tradingview indicator does is that it gives a level on the chart where most of the trading action has taken place.
How many buy and sell orders have taken place on a specific level can be easily identified using the VPVR indicator. The Visible Range indicator also shows you the Volume Number has been played out on each specific level.
VPVR is one of the most useful tradingview indicators to determine Support and Resistance
The Support and Resistance levels can be identified by the Volume profile using a reactive method so they regularly alter with price action and give a clear vision to predict price movements in the future. Another feature of this useful tradingview indicator is that The Reactive method relies on past price movements at specific price levels and applies a better understanding of price reaction at meaningful levels.
In short, Support levels are areas where the price is supported on the way down. Also, Resistance levels are areas that resist price on the way up. A simple way of understanding this is that Buyers will enter the market at the bottom of a profile and sellers will enter the market at the top.
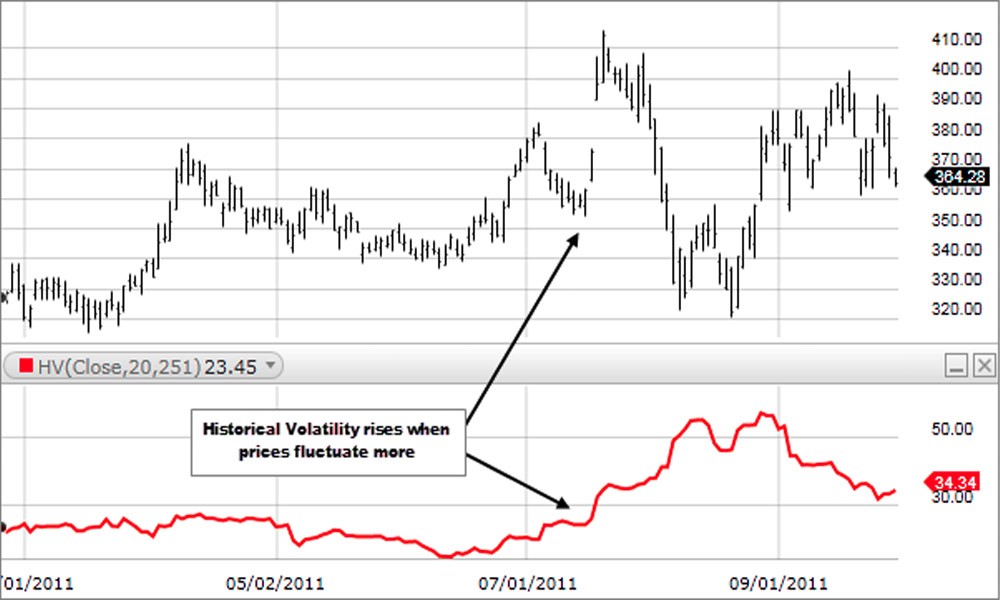
Historical Volatility Percentile (HVP)
This is one of the very powerful and useful tradingview indicators – especially don’t the macro time frame. This indicator will show you where relatively the volatility of the market is at any given time. In this indicator, the red section shows high volatility in the market and the lower – blue – bars show less volatility.
This indicator does not give you a direction of the market. However, it can be a good indicator of where a breakout can happen.
To explain how the HVP indicator might be used, let’s see what others have to say:
Volatility has a bad connotation, but many traders and investors can make higher profits when volatility is higher. After all, if a stock or other security does not move it has low volatility, but it also has a low potential to make capital gains. And on the other side of that argument, stock or other security with a very high volatility level can have tremendous profit potential but at a huge cost. Its loss potential would also be tremendous. The timing of any trades must be perfect, and even a correct market call could end up losing money if the security’s wide price swings trigger a stop-loss or margin call.
Investopedia
More Exclusive Useful Tradingview Indicators for FREE
Although these indicators are useful, you might find it hard to understand the data and information that they give you. That is why our professional team at LaroGroups.com is working on Algorithmic Trading so that recognizing patterns and entry points can be as easy as it gets for you.
As a gift to our users, we decided to make some of the most useful tradingview indicators here (and more!) available for your use… and let’s not forget to mention that they are TOTALLY FREE!
These are only some of our products that help you with your trading. If you want to see more useful tradingview indicators, please go ahead and visit our range of products available online.
We hope that you found this post educational and learned about some of the useful tradingview indicators out there.
We will be posting more educational content and news regarding tradingview and other trading-related issues here on our website. We also have an Instagram page where we post educational material and special offers.