Pivot points are one of the many tools used in trading – and it’s an important one. Today, I will walk you through what pivot points are and how you can day trade using pivot points. At the end of this post, you will learn why traders love to pay attention to pivot points while day trading.
We will also introduce a new trading method called algotrading and share with you one of our automatic tools for trading which you can use to make your life easier.
- Table of contents
- What is pivot point bounce?
- What is ‘pivot level break out?’
- Calculate and day trade using pivot points
- How to open a position while day trading using pivot points
- Why everyone uses pivot points and why you should too!
- How to day trade using pivot points?
- Support and resistance pivot point strategy
- Bonus section!
Before getting into this topic, check out our algotrading tool that automatically draws patterns, pivots, candlesticks and MORE.
What is pivot point bounce?
There is no doubt that Pivot point bounce is one of the important strategies. It directs you, as a trader when to buy or sell a specific stock. The focus of this strategy is to find the bounce in prices at pivot points in the chart. If the price of a particular stock touches the pivot point and bounces back, then it is an indication to open a trading position.
Now, the question is when to buy/sell and day trade using pivot points bounce strategy?
Here, based on the pivot point bounce, it is recommended to buy the stocks when there is an upward bounce on the upward side. On the other hand, if you are looking for a selling point, you can do so if there is a downward bounce.
One of the key points to note is setting the right position of the stop-loss order to reduce the losses. This is something that we have also talked about in this article.
This is upon the preference of the trader and how long he or she is willing to hold the stocks that the stop-loss order is adjusted. If you are looking for a short-time investment, then the stop-loss should be set above the pivot point, and on the contrary, if you are aiming for a long holding, then the stop-loss should be below the pivot point.
What is ‘pivot level break out?’
This is made through the stop-limit order strategy, and the position is opened when the price surpasses the pivot level.
The short trade is performed when the trend is downward and has a long position when the trend is upward (i.e. Bearish vs Bullish). Often, when day trading using pivot points like this, trade is performed sometime during the morning and starts with a short trade, and it is significant to utilize the stop-loss order threshold in an appropriate position to avoid potential loss.
The breakout trade most often is performed in the morning, and placing the stop-loss limit secures funds against unexpected price changes. It is viable to change the stop-loss at a position before the breakout to reduce the risk of losing money.

Calculate and day trade using pivot points
How to open a position while day trading using pivot points
While trying to day trade using pivot points, after doing the right analysis, the pivot levels play a significant role when the market opens each day.
- If a specific stock opens above the basic pivot level, it is supposed to follow a bullish trend.
- if the stock opens below the basic pivot level, it is most likely going to follow a bearish nature.
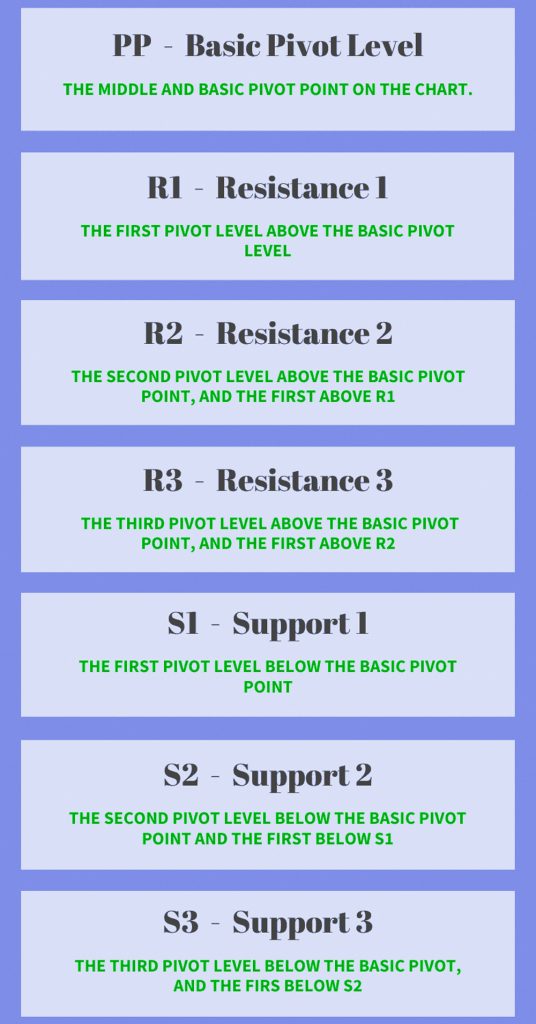
if you are looking to day trade using pivot points, you need to make a buy; the right time to do so would be if the stock is following a downward trade (Bearish) and surpasses the support pivot level R1 (Look at the top image to see what R1 means).
The support levels are below the basic pivot level, and the buyer starts when the stock reaches the support pivot level of Resistance 2 (R2).
Nevertheless, the trends are various and they change each day, and it is not mandatory to follow a particular order; the day trader who aims to day trade using pivot points is the one who decides to make a decision based on the entire technical analysis and strategy.

Why everyone uses pivot points and why you should too!
1) It is Unique for Day Trading
The formula related to pivot points uses data from the previous trading day and applies it to the current trading day. In this manner, the levels you are looking at are applicable only to the current trading day.
This feature makes this tool an ultimate unique indicator for day trading using pivot points.
2) It has High Accuracy
The pivot point indicator is one of the most accurate trading tools. The reason for this is that the indicator is used by many day traders, professionals and alike.
This will let the traders trade with more self-confidence and according to the flow of the market.
3) It has/uses a Rich Set of Data
Pivot points on charts provide a rich set of data. The indicator gives seven separate trading levels. This is without a doubt enough to take a day trader through the trading session.
4) Pivot Points are Easy to Use
The pivot point indicator is a very easy trading tool to use. Most of the trading platforms offer this type of indicator and you can day trade using pivot points.
This means that you are not required to calculate the separate levels; in fact, the products developed by Larogroups will do this for you. This way, your job as a trader will be to look at the automatically and accurately drawn lines and pivot points and then trade the bounces and the breakouts of the indicator.
How to day trade using pivot points?
1. Day trade using Pivot Points by Breakout Trading
To enter a pivot point breakout trade, you should open a position using a stop-limit order when the price breaks through a pivot point level. These breakouts will mostly occur in the morning.
If the breakout is bearish, then you should initiate a short trade. If the breakout is bullish, then the trade should belong.
Always use a stop loss when trading pivot point breakouts.
If you’re looking for a good place to stop, a day trader would be a top/bottom which is located somewhere before the breakout. By doing this, your trading position will be secured against unexpected price changes and the volatilities of the market.
You should hold your pivot point breakout trade at least until the price action reaches the next pivot level.
2. Day trade using Pivot Points by Bounce Trading
This is another pivot point trading approach. Instead of buying breakouts, in this pivot point trading strategy, we emphasize the examples when the price action bounces from the pivot levels.
If the stock is testing a pivot line from the upper side and bounces upwards, then you should buy that stock.
On the other hand, if the price is testing a pivot line from the lower side and bounces downwards, then you should short the security.
As usual, the stop-loss order for this trade should be located above the pivot level if you are short and below if you are long.
To be more specific, pivot point bounce trades should be held at least until the price action reaches the next level on the chart.
Support and resistance pivot point strategy
The use of the S1 and S2 (Support 1 and 2), and R1 and R2 pivot points (Resistance 1 and 2), can help a trader to gauge entries more effectively. Instead of chasing a rally or pursuing a falling market, a dip to the support level at S1 and then a rally to R1 provides a more effective way of trading than trying to buy when the price has hit R1.
As ever in trading, it makes sense to find the trend and go with it, so in a broader uptrend a trader will wait for pullbacks to S1 or S2, and in downtrends, they will aim to sell at retracements towards R1 or R2.
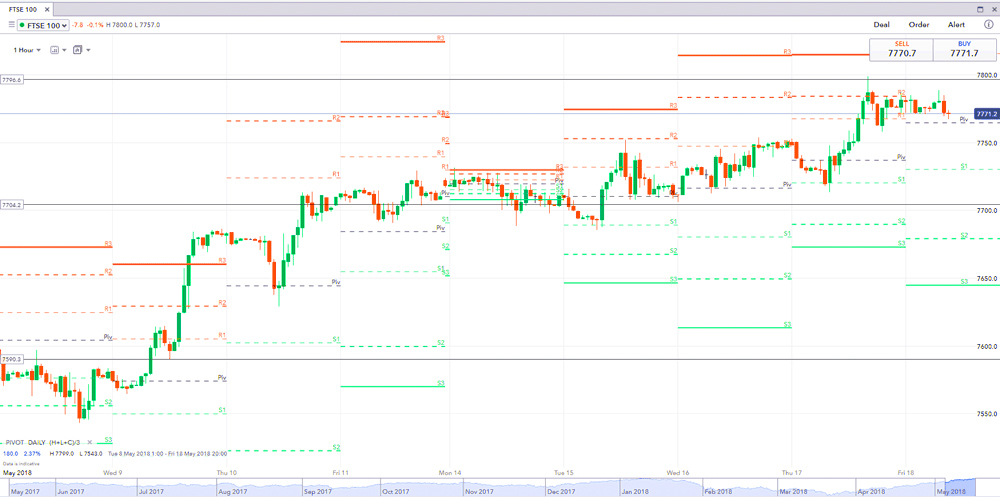
An example of an uptrend is seen below, in the FTSE 100 chart. In this example we have ticked the ‘show historical pivot points’ box in the platform, to see how the price has behaved in previous sessions.
As can be seen, the price retraces to the daily pivot or to S1 several times, at which point a reversal takes place as buyers enter:

Even though this chart is a busy one, it does indicate one can day trade using pivot points.
In trading, it is important to add to your winning trades and cut your losing ones. In the above example, a trader could buy more of the as it rises, adding to their winning trade and increasing profit. Pivot points are another useful tool in a trader’s armoury.
These strategies are not foolproof one, however, they provide a way of employing the price to identify entries in a fashion that can help provide a logical and strategical approach to trading.
Placing Stops
Trading with pivot points allows you the ability to place clear stops on your chart. What you do not want to do is simply place your stops in line with the next level up or down.
You have to be more cautious when looking for your stop placement. Remember, you are not the only one that is able to see pivot point levels. All traders who have access to a charting application can see the R1, R2 and R3 levels.
How, then, can you protect your trade but without risking too much money?
To begin with, you could place your stop just beyond the levels. In other words, you will want to hide the stop behind logical price levels.
For example, when you want to day trade using pivot points, if you have an S1 level at $20.65, then you will want to place your stop at $20.44. Why at this level? 50 cents is a big mental price level for stocks under $21 bucks.
Therefore, you will likely have a large number of stops right at the level. So, if you place your stop slightly beyond this point, you might avoid being stopped out of the trade as a shakeout.
Bonus section!
The EASIEST way to day trade using pivot points and more!
Although pivot points are useful in day trading, you might find it hard to recognize and understand the data and information they give you. That is why our professional team at LaroGroups.com is working on Algorithmic Trading so you won’t need to worry about any of the technicalities! All you need to do is relax and let the computer draw trend lines and pivot points for you.
Don’t forget to check out the products below.
These are only some of our products that can help you trade more efficiently. If you want to see more useful tradingview indicators, go ahead and visit our range of products available on our website..
Summary of Pivot Point Level:
In this type of trading, If the analysis of the previous day is over the pivot point, the market is expected to follow a bullish nature. On the other hand, if the analysis of the previous day is below the pivot point, it is expected the market will follow a bearish nature.
Summary of pivot bounce:
Pivot point bounce is one of the important strategies, and it directs the trader when to buy the stock and when to sell them. The focus of this strategy is to find the bounce in prices at pivot points in the chart.
Summary of pivot breakout:
In this strategy, the short trade is performed when the trend shows a bearish performance and has a long position when the trend shows a bullish performance.
Conclusion
Pivots Points are price levels charts analysts use to determine intraday levels of support and resistance. This indicator draws upon the previous days Open, High, and Low to calculate a Pivot Point for the present day.
Three resistance and support levels are calculated and shown above and below the Pivot Point through using this Pivot Point as the base.
- Pivot Point support and resistance levels can be used exactly like traditional support and resistance levels. As with all indicators, it is of great significance to confirm Pivot Point signals with other aspects related to technical analysis.
How to Calculate Pivot points
Resistance Level 3 = Previous Day High + 2(Pivot – Previous Day Low)
Resistance Level 2 = Pivot + (Resistance Level 1 – Support Level 1)
Resistance Level 1 = (Pivot x 2) – Previous Day Low
Pivot = Previous Day (High + Low + Close) / 3
Support Level 1 = (Pivot x 2) – Previous Day High
Support Level 2 = Pivot – (Resistance Level 1 – Support Level 1)
Support Level 3 = Previous Day Low – 2(Previous Day High – Pivot)

